Unit Economics is not a new term. But it has become relevant due to the growing popularity of business models that work by subscription, for example, SaaS.
Unit Economics results show all expenses and revenues for 1 unit that can be 1 paying customer. If you want to evaluate the effectiveness of an advertising campaign to attract 1 new customer, then Unit Economics is what you need.
Let's analyze one of the most effective methods of evaluating the project or advertising campaign using the example of SaaS — calculation of Unit Economics.
Small mistake in calculation, big consequences in business

Part 1: Where to start
Unit Economics is a financial results per 1 unit.
Let’s divide the process into two phases.
- Define a unit — it can be a user, a paying customer, or a product
- Calculate revenue, cost and profit per unit
If you bought a product for $1,000, spent $500 on advertising, and sold it for $2,000, there's not much to calculate.
But if you sell your software by subscription (SaaS, software as a service), the calculations will be much more interesting.
You have a certain budget to attract the customer. You spend it on advertising, marketing, salaries of the Sales and Marketing department. Then you get a certain amount of revenue every month until the client unsubscribes from your service.
Costs can be direct and one-time — cost per click. And can be general costs such as the marketing manager salary.
Let’s calculate Unit Economics using SaaS business as an example.
Our product is a software with monthly subscription payments.
It may seem complicated at the beginning:

Just follow the steps, and you will understand how to build a financial model easily and fast.
Part 2: Input data
We received these input data from the marketing and sales department:
Number of visits, leads and registrations
- Number of visits to the site from paid traffic (UA) — 10 000 / month
- Conversion from visit to registration (C1) — 10%
- Conversion from registration to payment (C2) — 10%
Revenue Parameters
- Average revenue per paying user (ARPPU) — $200 / month
- Average customer lifetime (CL) — 4 months
Costs of attracting a customer
- Average cost per 1 visit from paid traffic (CPA) — $1
- Salaries of the Sales and Marketing department — $13 000 / month
- Other marketing costs — $4 000 / month
Now we need to get the results of Unit Economics and evaluate the effectiveness of advertising campaigns.
Part 3: Сalculations
To calculate faster and easier you can use our Feo platform with already embedded formulas. Just choose Unit Economics — SaaS template, fill in the input data and get the result.
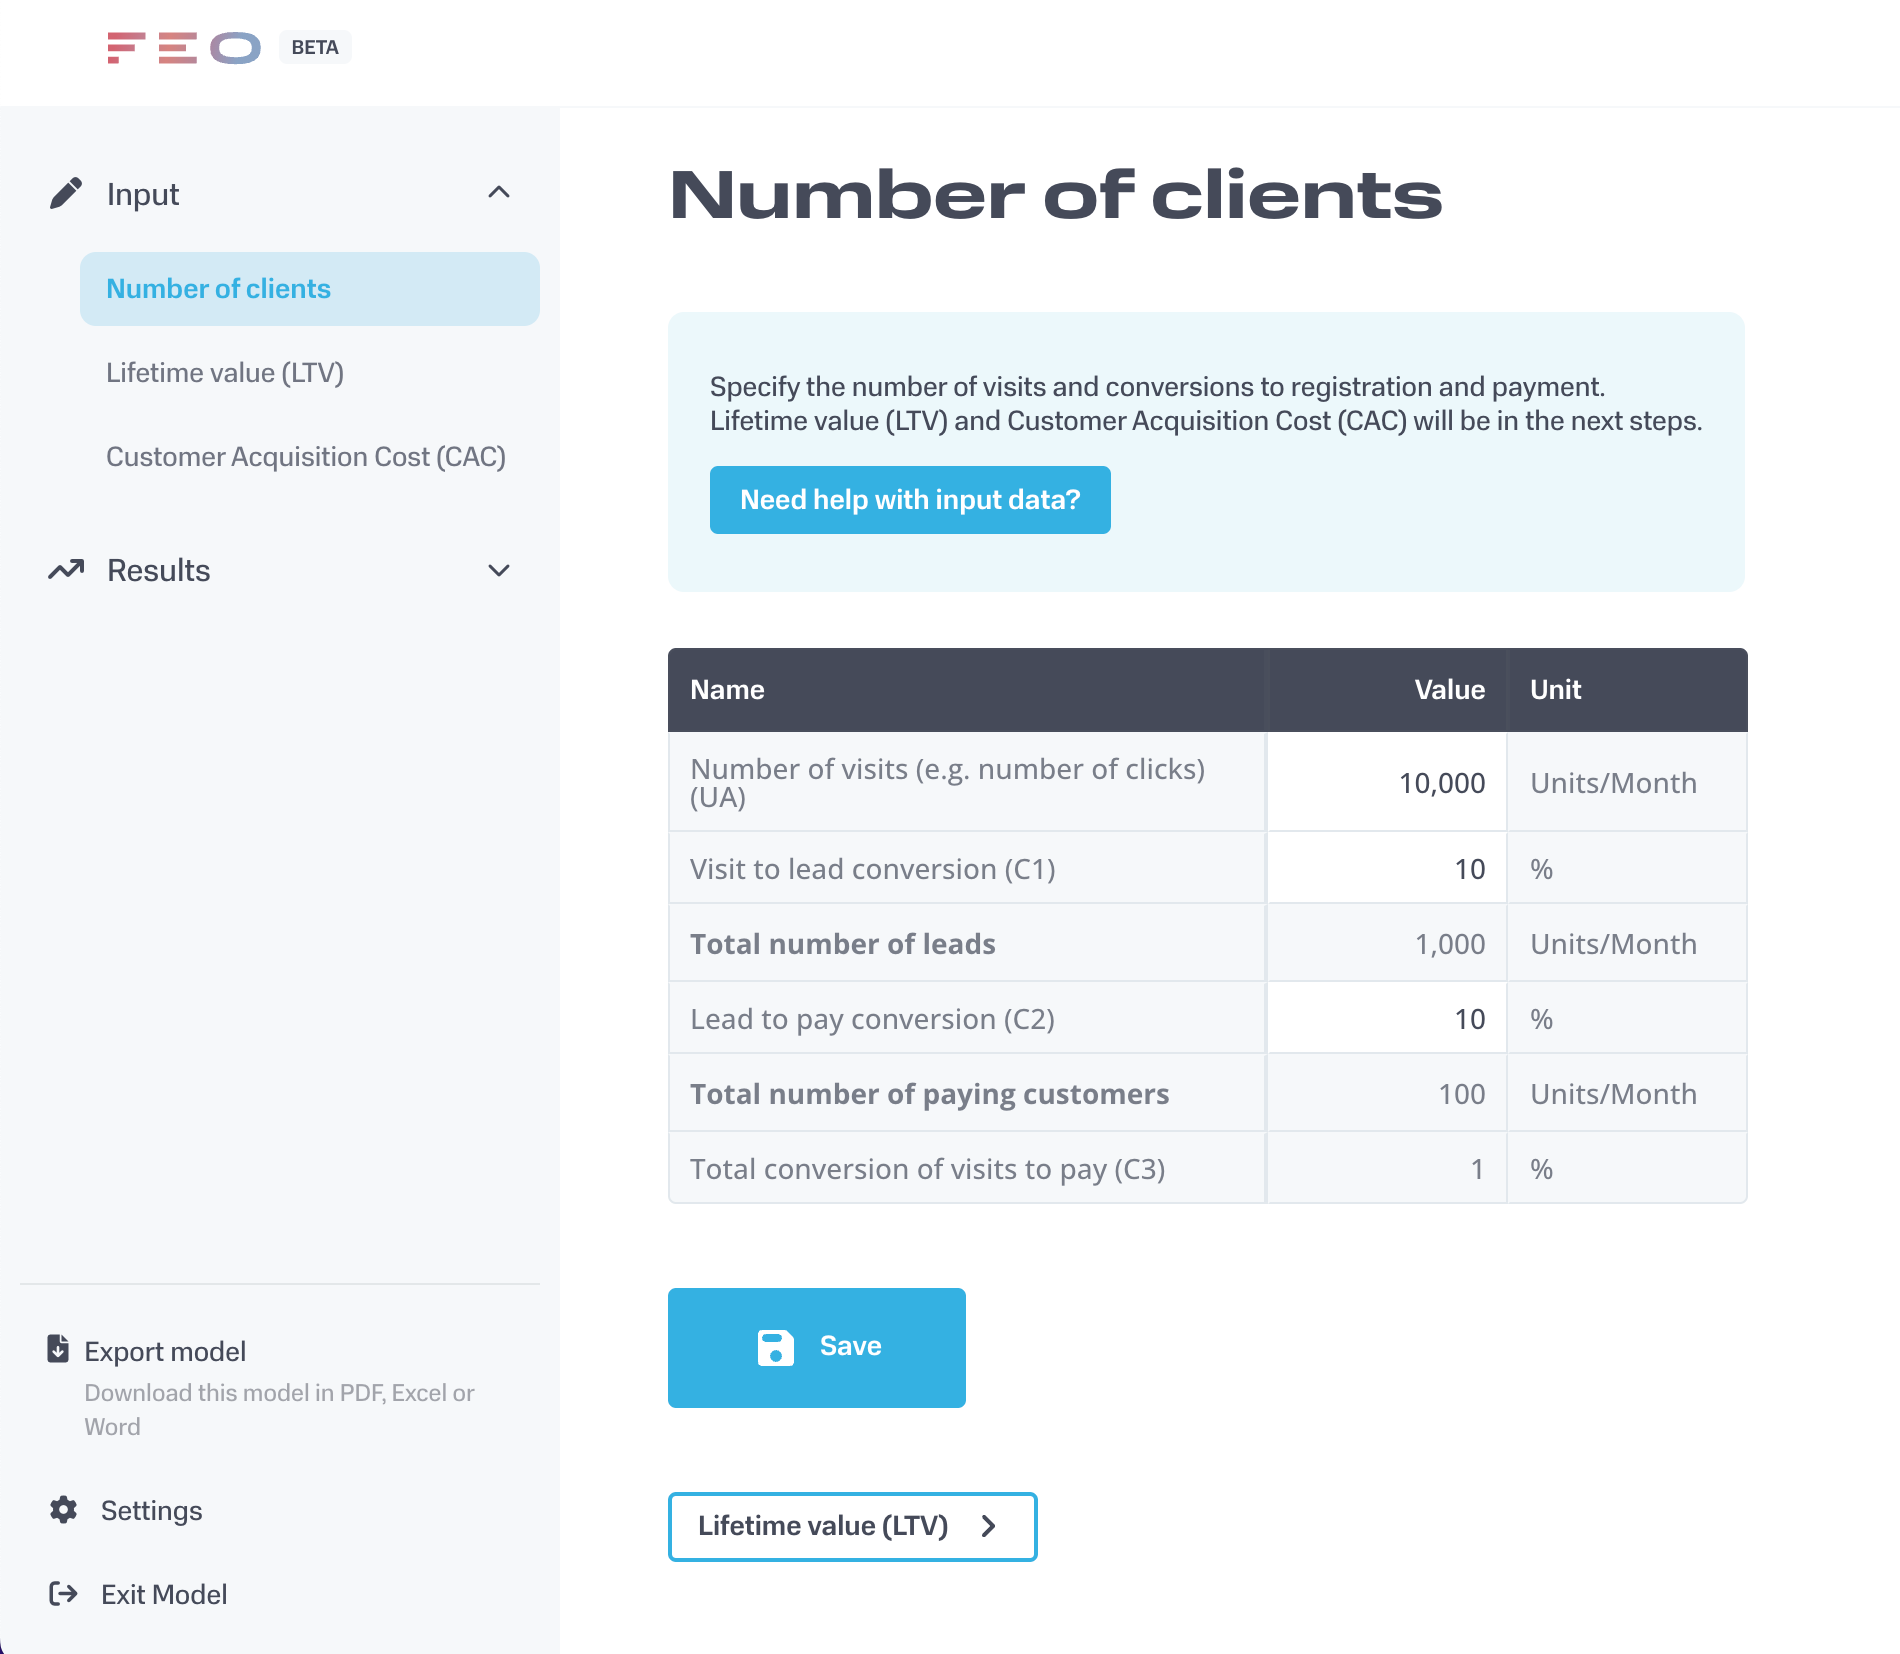
1. Calculate the number of paying users (B):
B = UA x C1 x C2
UA (number of visits from paid traffic) — 10 000 / month
x
С1 (conversion from visits to registrations) — 10%
=
Number of registered leads — 1 000 / month
x
С2 (conversion from registration to payment) — 10%
=
B (number of paying users) — 100 / month
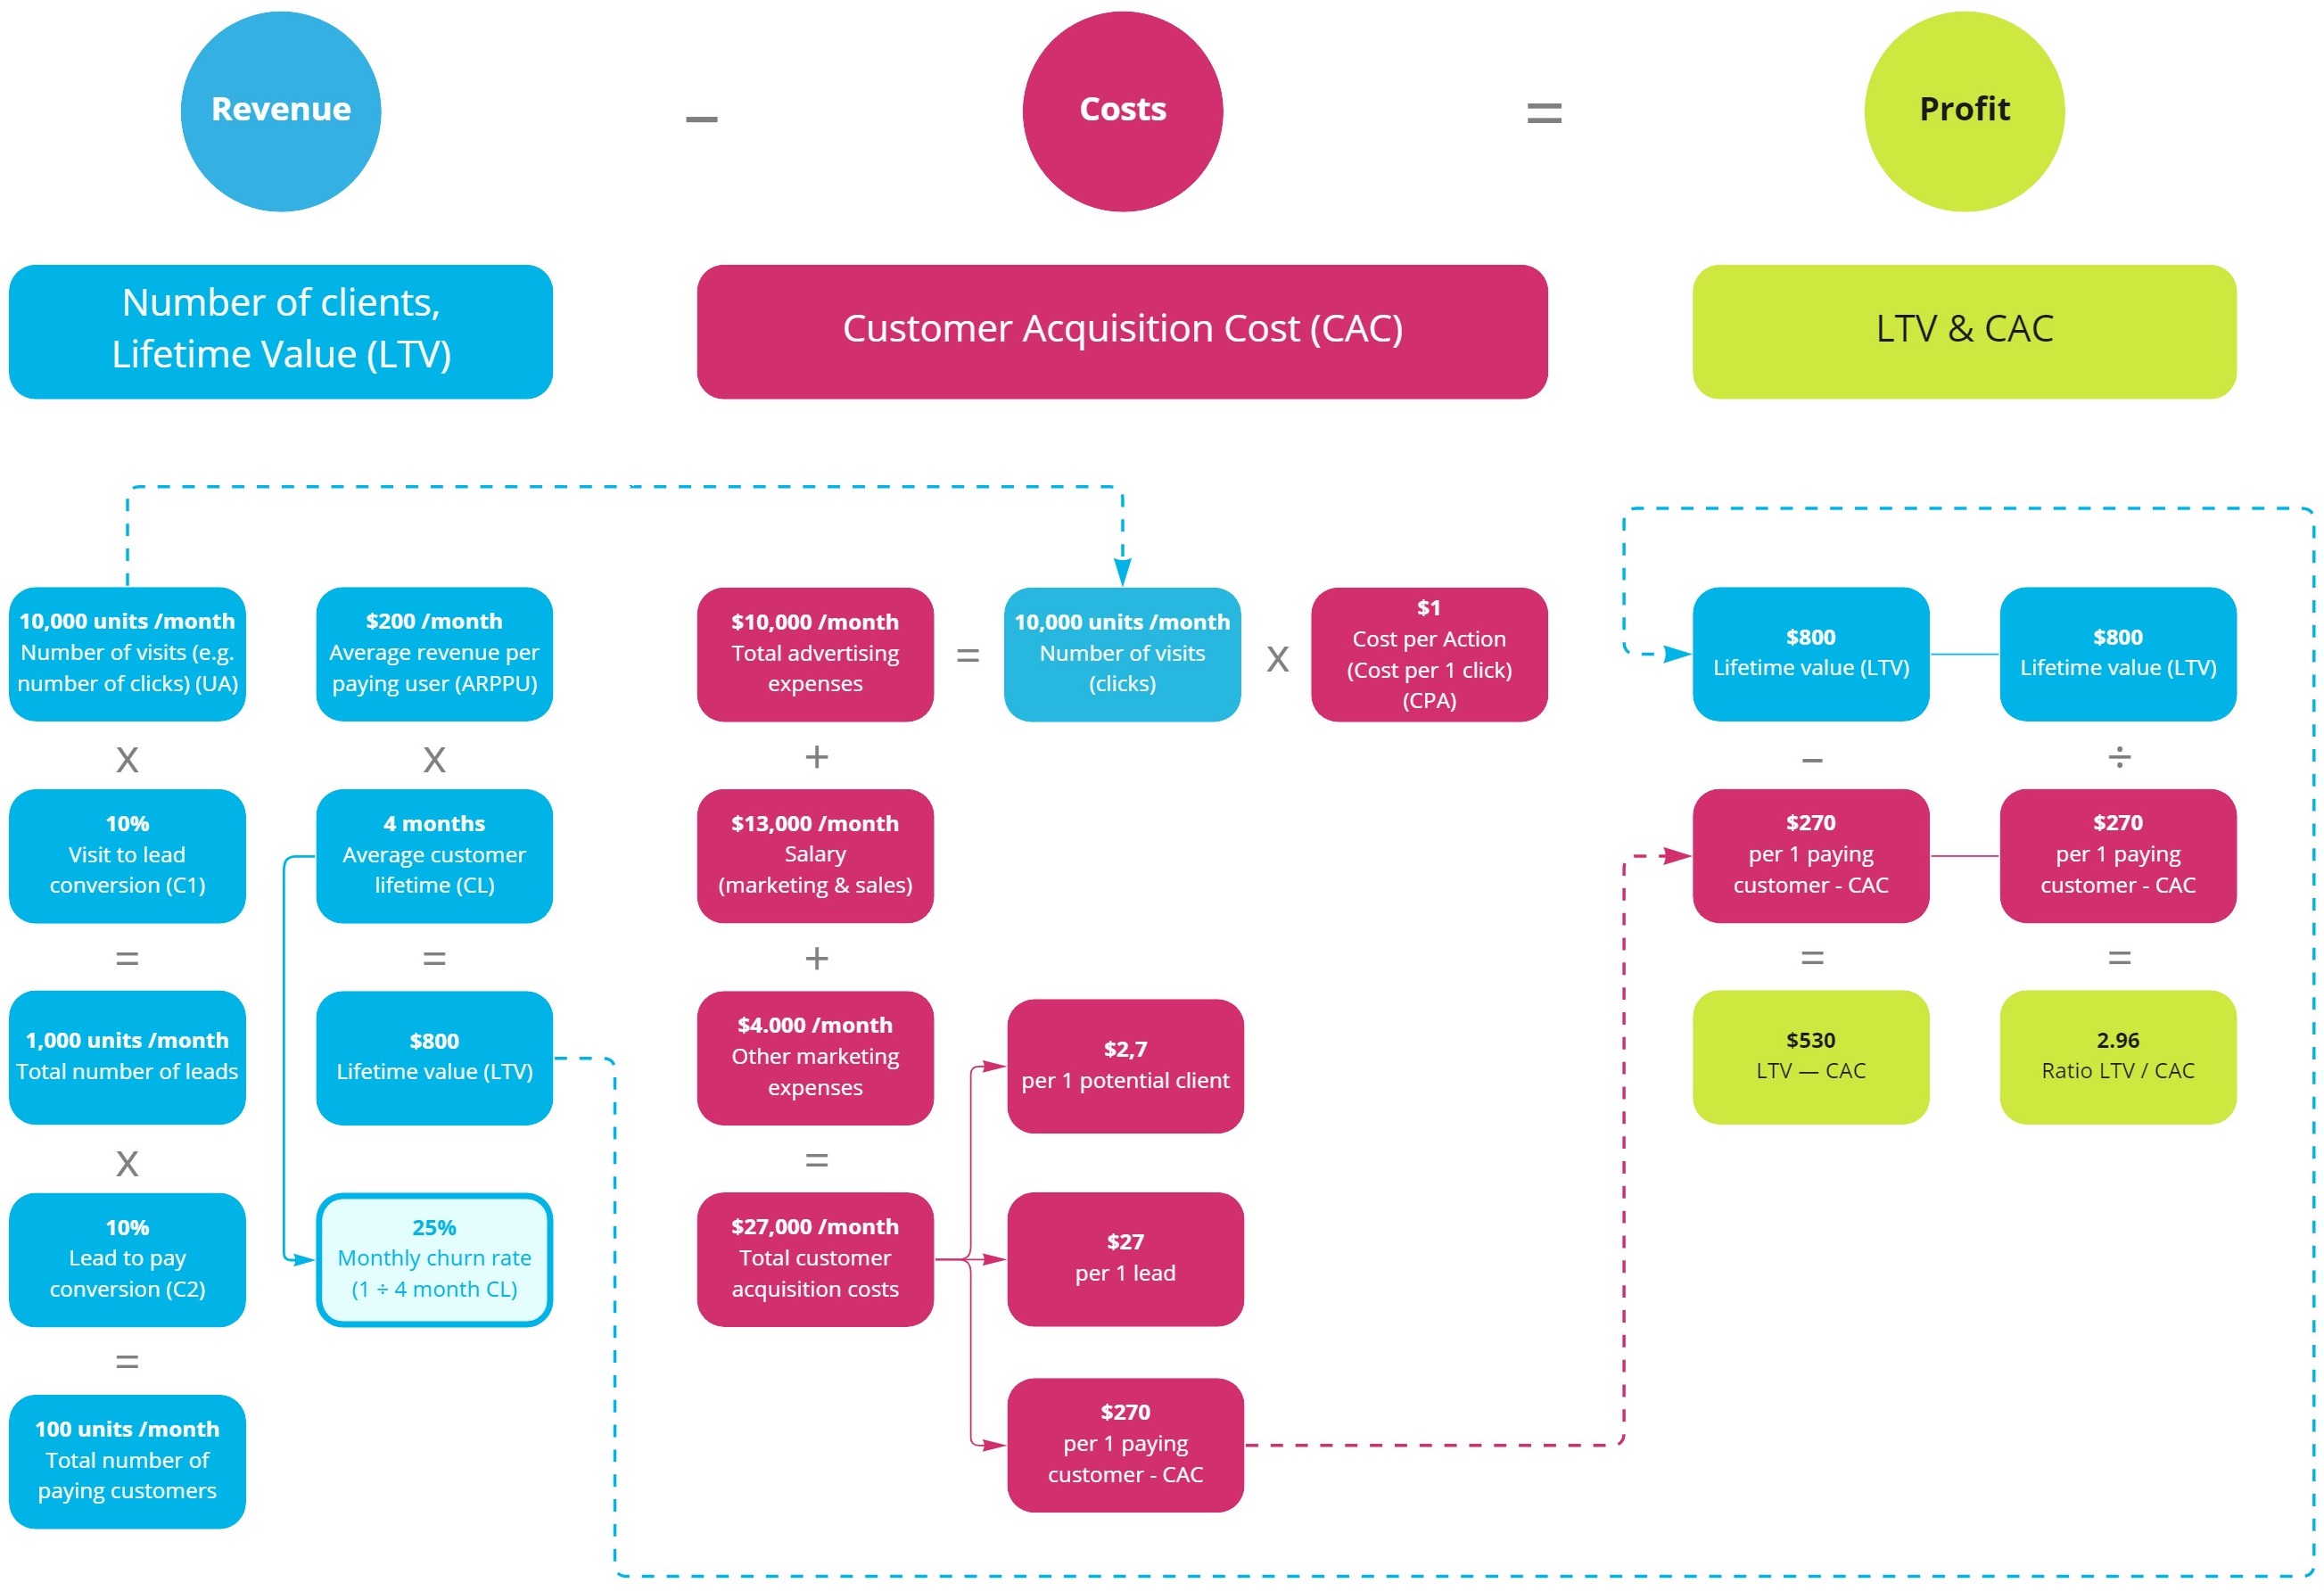
2. Calculate the customer lifetime value (CLV, LTV)
LTV = ARPPU x CL
ARPPU (average revenue per paying user) — $200 / month
x
CL (average customer lifetime) — 4 months
=
LTV (net revenue per user over the entire user lifetime) — $800
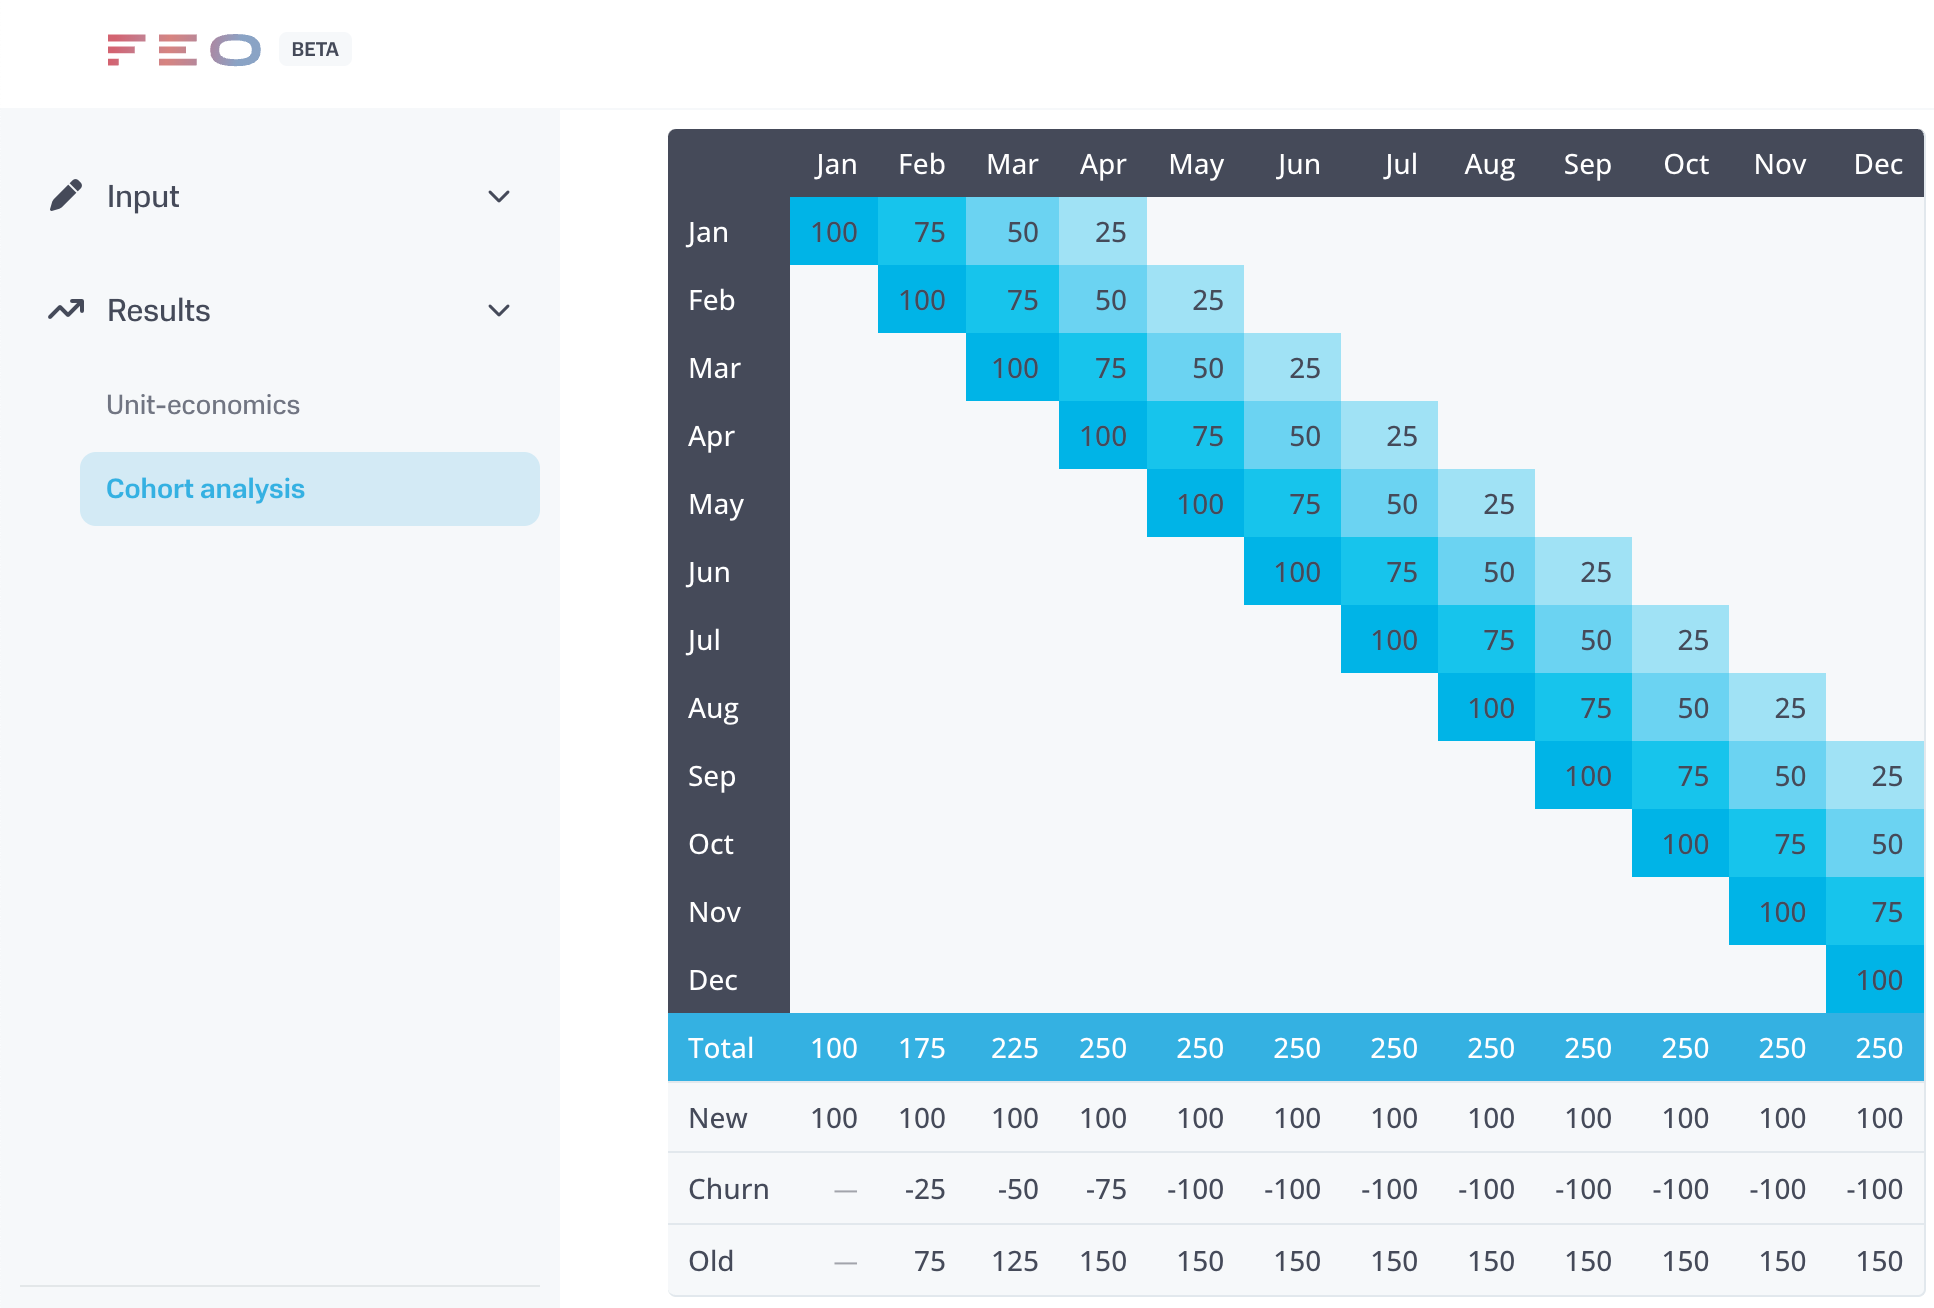
3. Calculate Churn rate (percentage of customers we are losing in a period of time)
To calculate the Churn rate, let’s use the simple formula:
Churn rate = 1 / CL
Churn rate = 1 / 4 months = 25%.
This means that every month 25 people out of 100 new users will unsubscribe from our service.
First month: 100 users
Second month: 100 new users + 75 users from the first month (with 25% Churn Rate) = 175 users in total
Third month: 100 new users + 75 users from the second month + 50 users from the first month = 225 users
And so on.
See Cohort Analysis data
4. Calculate the customer acquisition cost (CAC)
CAC = marketing costs / number of paying customers
4.1. Advertising costs
Advertising costs = UA x CPA
UA (number of visits from paid traffic) — 10 000 / month
x
CPA (average cost per 1 visit from paid traffic) — $1
=
Advertising costs — $10 000
4.2. Salaries of the Sales and Marketing department — $13 000 / month
4.3. Other marketing costs — $4 000 / month
Total marketing costs for attracting customers = $10 000 + $13 000 + $4 000 = $27 000
CAC (cost of attracting one customer) = $27 000 / 100 customers = $270
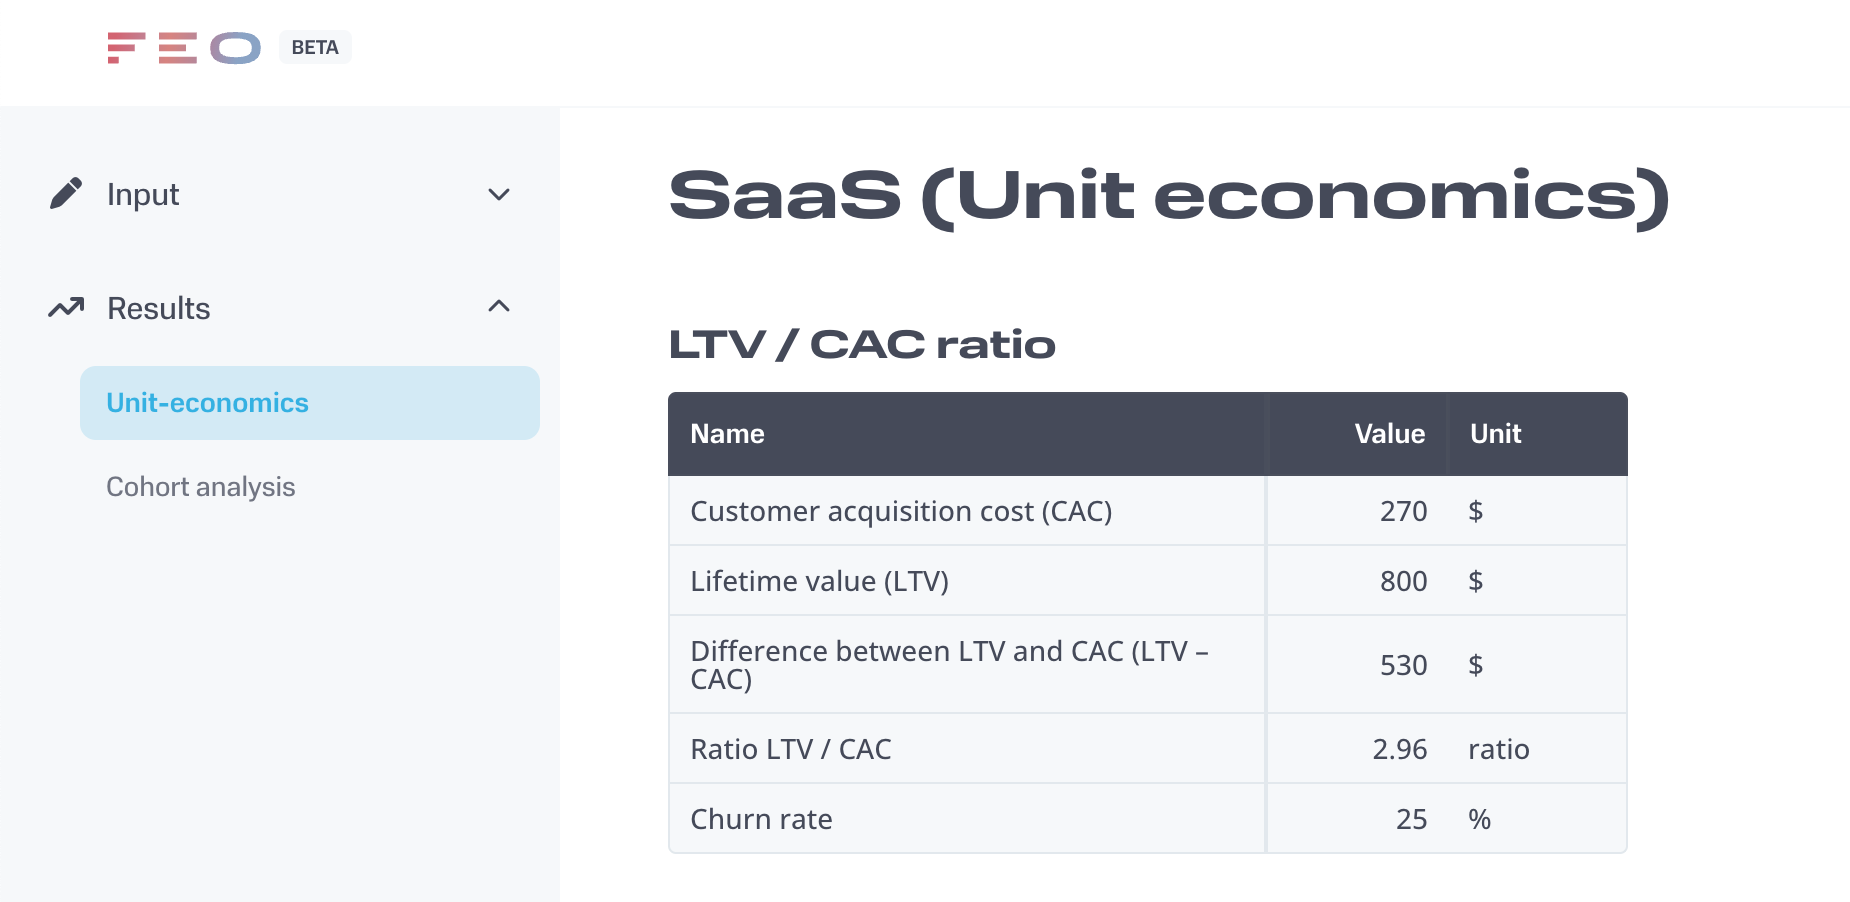
5. Let's compare LTV and CAC
LTV < CAC — there is no point in running a project or advertising campaign because the profit per customer is less or equal to the cost of attracting the customer
LTV = CAC — work for work’s sake
LTV > CAC — all good, the economics is positive, you can scale the advertising campaign
LTV – CAC performance difference shows the marginal profit per customer
$800 – $270= $530
LTV / CAC ration shows how many times the net revenue exceeds the cost of attracting one client
$800 / $270 = 2.96
On average, the goal is to achieve LTV / CAC value > 3. It allows you to scale advertising campaigns with minimal risk.
Part 4: Visualisation
Part 5: Best case scenario
Hang on! We are almost there.

The higher the LTV / CAC ratio, the better. It is similar to an advertising campaign flywheel that you can and should spin. There are only two elements in our equation, so we have to work separately on increasing LTV and separately on decreasing CAC.
To illustrate clearly the LTV / CAC correlation, we need to build a sensitivity analysis.
Sensitivity analysis shows how each element of the equation affects the final result.
The chart below shows the different LTV / CAC ratios that Feo calculates automatically.
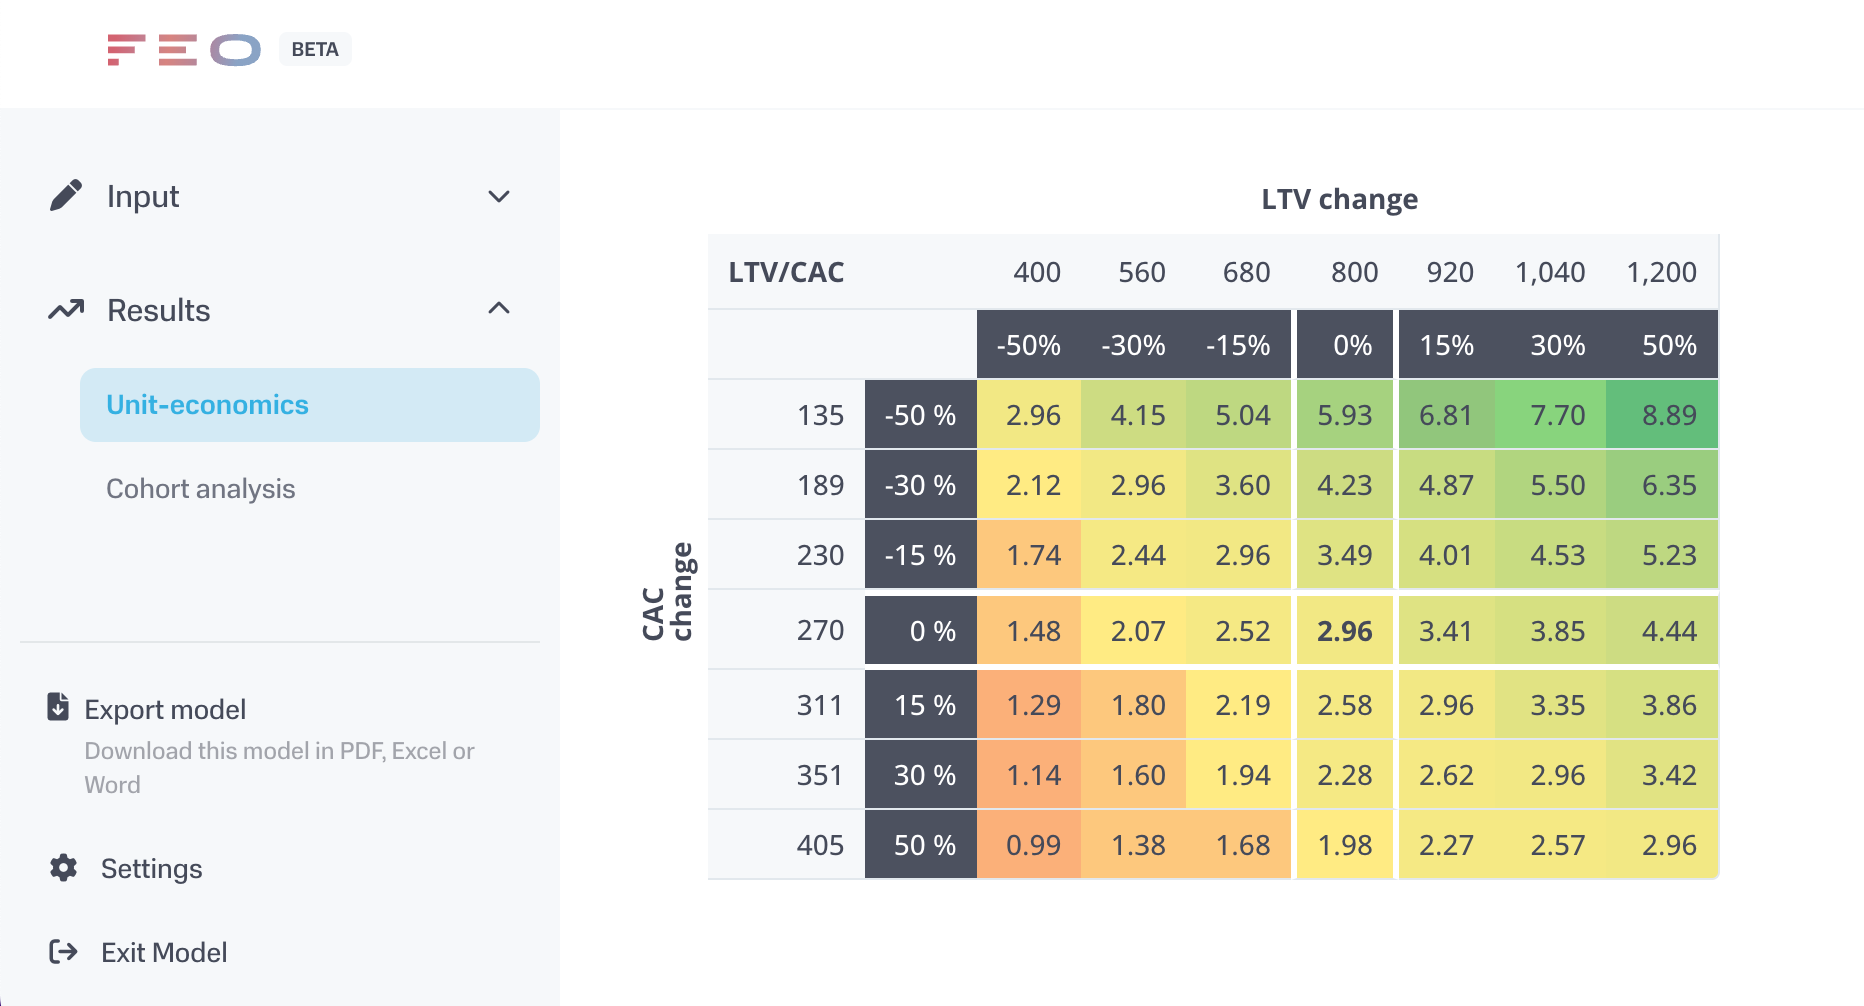
*The example shows the correlation of a particular SaaS model. The correlation in your projects will be different. To build it, create your SaaS model (Unit economics), specify your input data, and go to the results section.
Our current position is at the intersection of LTV = $800, CAC = $270, or 0% deviation from baseline (chart center), LTV / CAC = 2.96. That's a good indicator.
Let's see how it will change when one or two factors change.
One-factor Influence (LTV or CAC):
If LTV increases by 15% to $920 (take 1 step to the right of the chart center), the LTV / CAC ratio = 3.41
If CAC decreases by 30% to $189 (take 2 steps up from the chart center), the LTV / CAC ratio = 4.23
Two-factor influence (LTV and CAC simultaneously):
If LTV increases by 15% to $920 and CAC decreases by 30% to $189 simultaneously, the LTV / CAC ratio = 4.87
This advertising campaign can and should be scaled.
But if LTV decreases by 50% to $400 and CAC increases by 50% to $405, the LTV / CAC ratio = 0.99
Then any advertising budget will result in a loss.
We need to search for solutions to increase LTV and decrease CAC. To make sure the LTV / CAC ratio is more than 3. We can see all possible options from the chart above.
We made it!
Useful Tips
- Calculate Unit Economics before and after advertising campaigns, make a cross-section of key metrics, and track changes.
- The Unit Economics can be divided by individual products and individual advertising campaigns. Then you will see campaigns that could and should be scaled, and the unprofitable campaigns can be changed or turned off.
- To build a financial model of your startup, choose the SaaS financial model template, fill in your initial data, and go to the results.
Unit Economics Terms
| Abbreviation | Definition | Explanation |
|---|---|---|
| UA | User acquisition | The number of users on the website. The user is not necessarily your client, he can leave the site without buying your service |
| С | Conversion rate | Conversion. For example, from visiting the site to registering. Or from registration to payment |
| B | Buyers | Number of paying customers |
| CPA | Cost per action | Cost per target action. For example, the cost of 1 click from paid advertising |
| AvP | Average price | The average check is the amount a customer pays on average per order |
| ARPC | Average revenue per client | Average revenue per customer |
| ARPU | Average revenue per user | Average revenue per user |
| ARPPU | Average revenue per paying user | Average revenue per paying user |
| CL | Customer lifetime | Customer lifetime (subscription validity period) |
| Churn Rate | Churn rate | The churn rate is the percentage of your customers who unsubscribe within a certain period |
| LTV CLV |
Lifetime value Customer lifetime value |
Total net revenue per customer for the entire period of using the product |
| CAC | Customer acquisition costs | The cost of attracting 1 customer |
